
The State of McKinsey Solve 2026: What 26,622 Practice Runs Reveal
Most of what gets written about McKinsey Solve is recollection. This study is telemetry. Between December 2025 and August 2026, 5,174 candidates completed 26,622 timed runs across our three simulators — Sea Wolf, the Red Rock Study, and the Sustainable Futures Lab. Every run stores a scored breakdown, so we can see not just what people scored, but which specific part of each game bled the points.
Four things stood out: how much scores move between a candidate's first and best run, which component of each game is failed most, how little practice most candidates actually do, and how brutally late that practice happens. Every number below comes from a query you can read in full — and none of it is a claim about McKinsey's own scoring, which nobody outside the firm can see.
The four findings
- Repeat runs score higher in all three games — a median +20.3 percentage points in Red Rock, +10.4 in the SFL, +6.7 in Sea Wolf. After stripping the regression-to-the-mean component with a permutation placebo, roughly half of that survives (+11.4 / +5.7 / +3.3).
- Consistency is the single worst-performing component anywhere in Solve: SFL candidates lose 60.7% (95% CI 59.4–62.0) of the available consistency points.
- 47% of game-user pairs are a single run that is never repeated; the modal returning user does two or three.
- Of the 3,401 candidates who stated a test date and practised before it, 70.3% do not start until the final 48 hours (66.0% of all 3,622 candidates who stated a date) — median lead time between first run and test day is one day.
Methodology
Source: completed simulator sessions stored by SolvePrep. No surveys, no self-reports, no demo or leaderboard placeholder rows. Session-level detail is available for runs from December 2025 onward, which defines the window below. Data pulled August 20, 2026. Study release v1.2. Totals across the three games cover 5,174 distinct candidates; a candidate who plays two games appears in two rows. The aggregate tables behind every figure are downloadable as CSV and JSON.
| Simulator | Completed runs | Distinct users | Observation window |
|---|---|---|---|
| Sea Wolf Game | 7,152 | 3,061 | Dec 30, 2025 – Aug 19, 2026 |
| Red Rock Study | 11,063 | 3,528 | Feb 22, 2026 – Aug 20, 2026 |
| Sustainable Futures Lab | 8,407 | 2,415 | Apr 1, 2026 – Aug 20, 2026 |
- Red Rock and the SFL store a percentage score directly. Sea Wolf stores points out of 300 (three sites × 100), normalised here to a percentage.
- "Points lost" per component = 1 − (sum of points scored ÷ sum of points available) across all runs, so heavier components are not over-weighted.
- Component analysis uses only runs with a complete stored breakdown: 10,940 of 11,063 Red Rock runs (98.9%) and 8,317 of 8,407 SFL runs (98.9%). The remainder predate a breakdown-schema change and are excluded rather than imputed. Sea Wolf stores a per-site breakdown for 100% of completed runs, so its error rates use the full 7,152 runs (21,456 submitted sites).
- Improvement is measured within a user, on the same game: best run minus first run, for users with two or more runs. Because best-of-k is upward-biased, the first→second gain and an order-permutation placebo are published alongside it.
- Every median and every loss share carries a percentile-bootstrap 95% confidence interval (10,000 resamples, resampled at the user level so repeat runs by one candidate are not treated as independent).
- Test-date analysis uses profiles.solve_test_date, self-reported by the candidate after signup.
1. First run to best run: scores move, and Red Rock moves most
For every user with at least two runs of the same game, we compared their first completed run with their best. The median Red Rock user gained 20.3 percentage points (95% CI 18.9–21.6), moving from 61.2% to 81.5%. Sea Wolf users gained least — 6.7 points (95% CI 5.8–7.6), from 71.4% to 78.1% — which fits a game with one scored decision per site and far less room to recover a bad start.
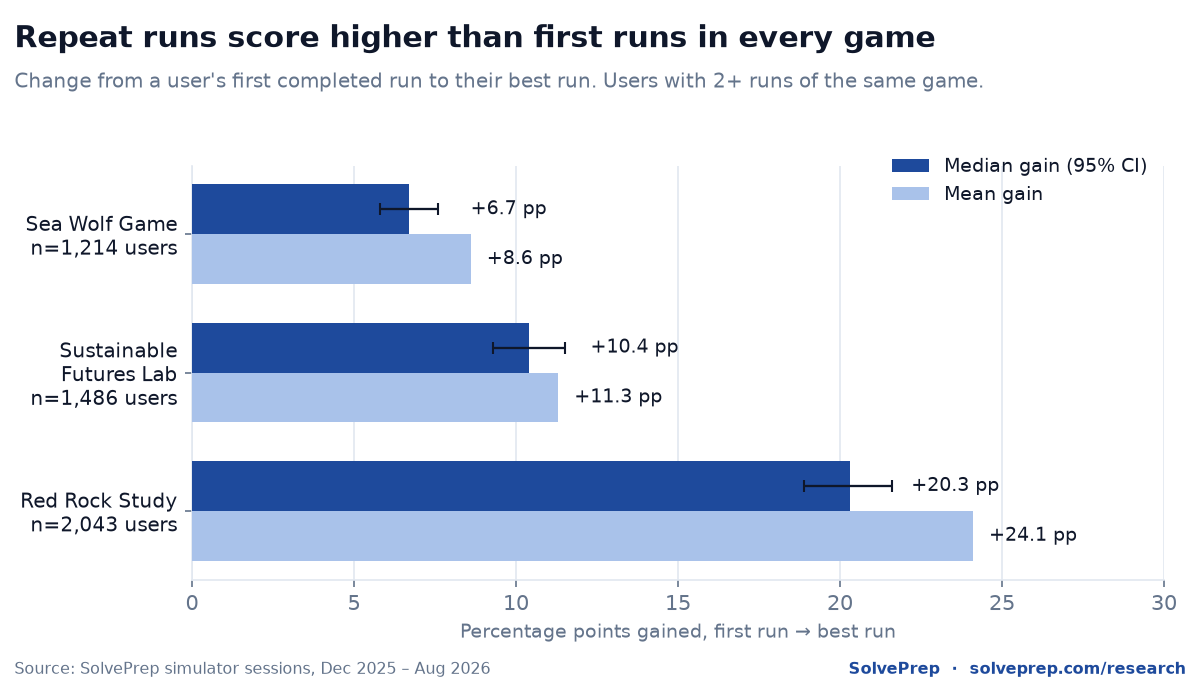
| Game | Repeat users | Median gain | 95% CI | Mean gain | Median first → best | Improved at all |
|---|---|---|---|---|---|---|
| Red Rock Study | 2,043 | +20.3 pp | 18.9 – 21.6 | +24.1 pp | 61.2% → 81.5% | 76.5% |
| Sustainable Futures Lab | 1,486 | +10.4 pp | 9.3 – 11.5 | +11.3 pp | 58.4% → 68.8% | 71.8% |
| Sea Wolf Game | 1,214 | +6.7 pp | 5.8 – 7.6 | +8.6 pp | 71.4% → 78.1% | 59.1% |
How much of that gain is real?
"Best minus first" flatters itself: the maximum of k noisy draws rises with k even when nothing is learned. So we ran two counterweights. The first is the plain first→second gain, which has no max-of-k selection in it. The second is an order-permutation placebo: each user's own runs are shuffled 10,000 times and the same statistic recomputed. Shuffling does not move a user's maximum, so what the placebo measures is best minus a randomly positioned run — the gain you would see from within-user variance alone, with no learning in it. The difference between the headline and the placebo is the part that is not explained by noise.
| Game | Headline (best − first) | First → second run | Permutation placebo | Net of placebo (descriptive) |
|---|---|---|---|---|
| Red Rock Study | +20.3 pp | +11.8 pp | +8.9 pp | +11.4 pp |
| Sustainable Futures Lab | +10.4 pp | +6.1 pp | +4.7 pp | +5.7 pp |
| Sea Wolf Game | +6.7 pp | +3.9 pp | +3.4 pp | +3.3 pp |
The net column is a plain difference of two medians and is reported as descriptive: unlike every other estimate on this page it carries no bootstrap interval, because the difference of two medians computed on overlapping resamples needs its own resampling loop (query block 10) rather than the one behind the headline CIs. Read it as a direction and a rough magnitude, not a precise estimate. Roughly half of the headline gain in every game is regression to the mean. The surviving movement — +11.4 pp in Red Rock, +5.7 in the SFL, +3.3 in Sea Wolf — is the number worth quoting, and it is closely tracked by the independent first→second measure, which is what you would expect if it is real. Even so, this is not proof that practice causes improvement: candidates who come back are self-selected, and part of the remainder is familiarity with our scenario generator rather than transferable skill. Treat the headline figures as an upper bound and the net column as a floor.
2. The most-failed component in Solve is consistency, not maths
Aggregating every scored sub-component across all runs, one number dwarfs the rest. In the Sustainable Futures Lab, candidates lose 60.7% (95% CI 59.4–62.0) of the available consistency points — the score for whether your later decisions stay coherent with your earlier ones. Their judgment on any individual scenario is far stronger (33.5% lost), and their stakeholder management stronger still (24.5%). It is holding a line across thirteen linked questions that breaks them.
The Red Rock Study is much flatter: report (41.2%), analysis (38.5%), chart building (30.4%) and cases (27.9%) sit inside a thirteen-point band, and the two heaviest components are also the two worst. There is no single weak phase to drill — the losses are spread, which in practice means timing, not topic, is the binding constraint.
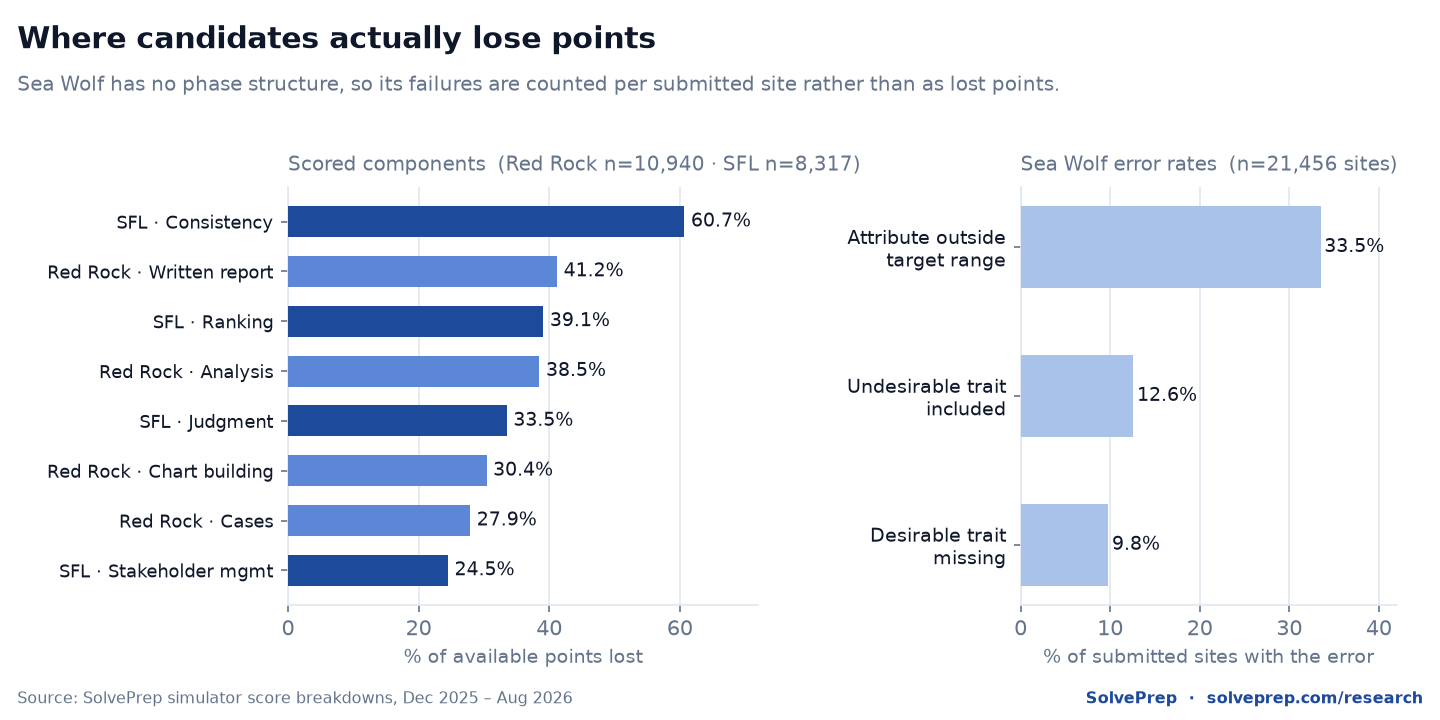
Sea Wolf has no phases — it is three site submissions — so we counted errors per submitted site instead:
- 33.5%An attribute average outside the site's target range
- 12.6%An undesirable trait included in the selection
- 9.8%The required desirable trait missing entirely
Trait errors are the rarer failure because they are binary and candidates learn the rule fast. Range errors are roughly three times as common, because they require averaging three microbes across three attributes under a shared 30-minute clock. Full component list:
| Component | Game | Weight | Available points lost | 95% CI |
|---|---|---|---|---|
| Consistency across linked decisions | Sustainable Futures Lab | 20 pts | 60.7% | 59.4 – 62.0 |
| Written report | Red Rock Study | ~25% of total | 41.2% | 40.1 – 42.3 |
| Priority ranking | Sustainable Futures Lab | 18 pts | 39.1% | 37.8 – 40.4 |
| Analysis (calculations) | Red Rock Study | ~40% of total | 38.5% | 37.6 – 39.4 |
| Situational judgment | Sustainable Futures Lab | 65 pts | 33.5% | 32.6 – 34.4 |
| Chart building | Red Rock Study | ~15% of total | 30.4% | 29.2 – 31.6 |
| Cases | Red Rock Study | ~20% of total | 27.9% | 26.9 – 28.9 |
| Stakeholder management | Sustainable Futures Lab | 15 pts | 24.5% | 23.4 – 25.6 |
Red Rock's Investigation phase is not separately scored — it feeds the Analysis and Report phases — so it is excluded rather than reported as zero. The SFL list is complete: its four components (judgment 65, consistency 20, ranking 18, stakeholder 15) sum to the full 118-point maximum.
Does the component table reconcile with the scores?
Component losses and headline scores are two views of the same points, so they have to agree. Weighting each component by its share of the available points gives an implied mean total per game; here it is against the pooled median of every run in that game.
| Game | Implied mean from components | Pooled median of all runs |
|---|---|---|
| Red Rock Study | 64.1% | 66.0% |
| Sustainable Futures Lab | 62.2% | 63.4% |
| Sea Wolf Game | 75.4% | 76.5% |
The implied mean sits one to two points below the median in each game, which is the signature of a left tail: abandoned and heavily timed-out runs drag the mean down without moving the middle. Sea Wolf's implied mean is derived from its per-site error rates and the 100-point-per-site deduction model.
3. Most candidates practise two or three times, then stop
Across all three simulators, 4,261 of 9,004 game-user pairs are a single run — one attempt, never repeated. Returning users cluster at two or three runs. Only a tail (681 pairs) reaches seven or more, and that tail generates a disproportionate share of all sessions: 283 Red Rock users account for 3,538 of its 11,063 runs.
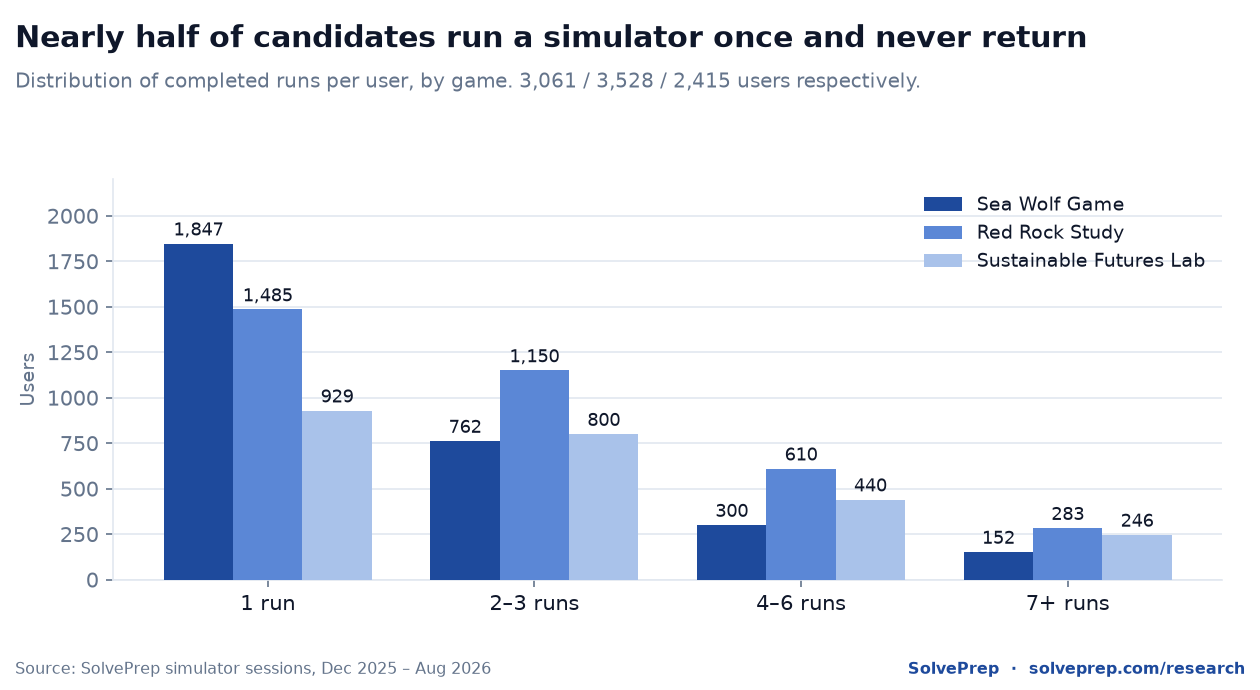
| Runs per user | Sea Wolf | Red Rock | SFL |
|---|---|---|---|
| 1 run | 1,847 users | 1,485 users | 929 users |
| 2–3 runs | 762 users | 1,150 users | 800 users |
| 4–6 runs | 300 users | 610 users | 440 users |
| 7+ runs | 152 users | 283 users | 246 users |
Median score by volume bucket tells a more careful story than the improvement finding does. All three games trend mildly upward with volume — Sea Wolf 68.9% → 80.1%, Red Rock 63.5% → 74.6%, SFL 57.9% → 65.4% — but the gap between the one-run and seven-plus buckets is smaller than the first-to-best gains, because the high-volume bucket is also where the candidates who found the game hard end up.
| Runs per user | Sea Wolf median | Red Rock median | SFL median |
|---|---|---|---|
| 1 run | 68.9% | 63.5% | 57.9% |
| 2–3 runs | 74.2% | 66.2% | 60.3% |
| 4–6 runs | 78.4% | 71.8% | 63.7% |
| 7+ runs | 80.1% | 74.6% | 65.4% |
These bucket medians are unweighted descriptive medians of every run in the bucket, on the same user counts shown in the table above; they carry no confidence interval because they are not used to support an inferential claim. This is a survivorship pattern, not a dose-response curve. Read it as a description of who practises how much, not as evidence that the fourth run buys you points.
4. Practice is overwhelmingly last-minute
3,622 of the 5,174 candidates in the study (70%) stated a test date, and 3,401 of them completed at least one run before that date. The remaining 221 first practised after their stated date — a rescheduled or mistyped date, most likely — and are excluded from the buckets rather than folded into the last one. All shares below are therefore on a base of 3,401. Grouping each candidate by when they first practised, 2,392 (70.3%) did not start until the final 48 hours — 66.0% of everyone who stated a date at all. Another 19.0% started in the two-to-four-day window, and just 10.7% began more than four days out. The median lead time between a candidate's very first run and their test day is one day.
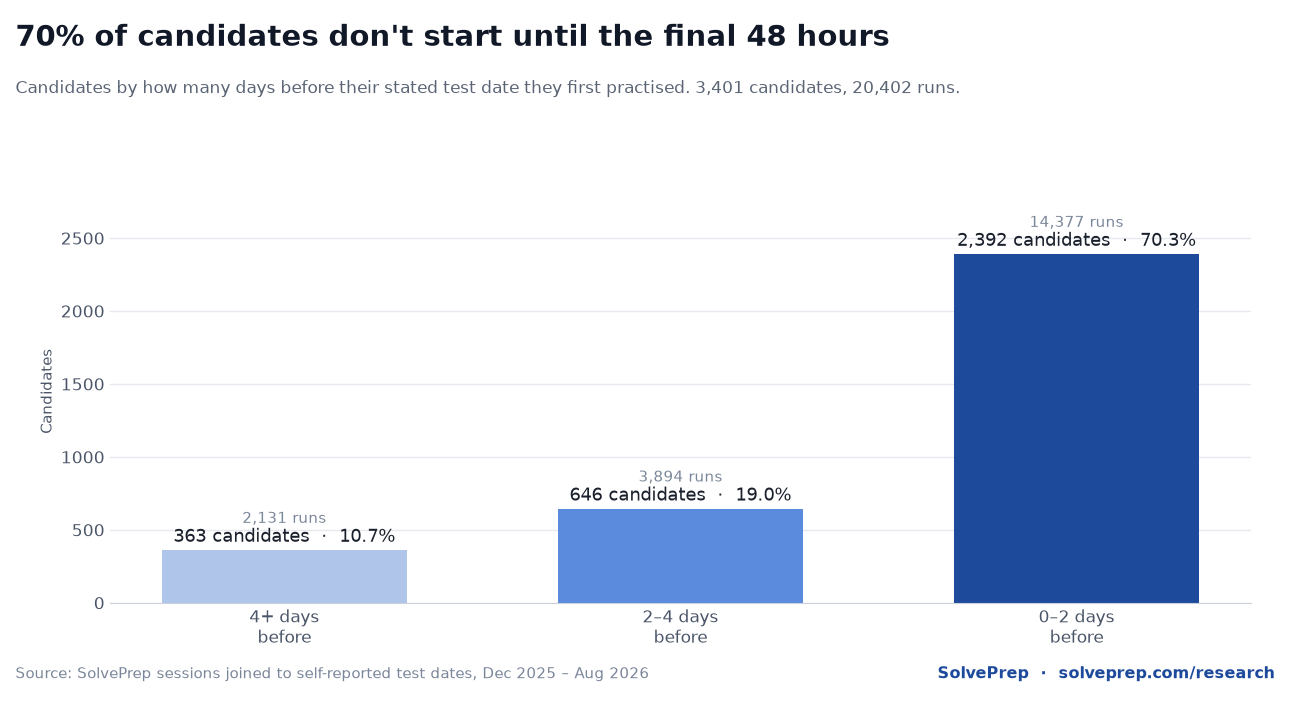
| Timing of first run | Candidates | Share of candidates | Runs |
|---|---|---|---|
| 4+ days before | 363 | 10.7% | 2,131 |
| 2–4 days before | 646 | 19.0% | 3,894 |
| 0–2 days before | 2,392 | 70.3% | 14,377 |
Buckets are mutually exclusive and sum to 3,401 candidates and 20,402 runs. The unit is the candidate's first run: a candidate who starts four days out and practises again the night before counts once, in the 4+ days row. The runs column counts every run by the candidates in that row, including runs after their test date — it is a measure of how much that cohort practises in total, not of pre-test volume.
Note the structural bias here: we ask for a test date at signup, and people typically sign up because a test is imminent. So this finding describes when our candidates practise, not the ideal preparation window. Read by candidate, only 363 of the 3,401 (10.7%) get started more than four days out — so beginning a week ahead already puts you ahead of roughly nine candidates in ten. Our prep plan is built around that reality.
Limitations
- These are simulator scores, not McKinsey scores. McKinsey does not publish its scoring model or candidate results. Nothing here should be read as a pass rate or a threshold.
- The sample is self-selected. Everyone in it chose to prepare with a paid or free simulator. Candidates who prepare with nothing are invisible to us, and are likely the weakest cohort.
- Repeat-run gains are partly familiarity and partly regression to the mean. The permutation placebo removes the second, not the first: a returning user knows the interface and the clock. Treat the headline gains as an upper bound and the net-of-placebo column as a floor.
- Confidence intervals cover sampling error only. They say nothing about selection into the sample, which is the larger source of uncertainty here.
- Test dates are self-reported and editable, and Finding 4 rests on the subset of users who set one. It is the weakest finding in the study and is presented as directional.
- Observation windows differ. Sea Wolf has eight months of data, the SFL under five, so cross-game comparisons carry unequal maturity.
- Component losses depend on our scoring weights, which reproduce the published and candidate-reported structure of each game but are ours, not McKinsey's. Red Rock weights vary slightly by generated scenario, so its component shares are averages across scenarios.
- 1.1% of Red Rock and SFL runs lack a stored component breakdown and are excluded from Finding 2 rather than imputed. They are included in every count-based figure. The Sea Wolf error rates use a different unit — the submitted site — and its coverage figure is reported in the methodology above.
References
External sources used for the structure and naming of the assessment. None of them supplied scores: McKinsey publishes neither its scoring model nor candidate results, so every score in this study is a SolvePrep simulator score.
- McKinsey & Company — Our application process (Solve assessment)The firm's own description of where Solve sits in the application process. Used for the game names and the position of the assessment in the funnel — not for scoring.
- McKinsey & Company — Solve, our problem-solving gamePublic description of the assessment format. McKinsey publishes no scoring model or candidate results, which is why every score in this study is a SolvePrep simulator score.
- SolvePrep — McKinsey Solve guideOur own structural documentation of each game, reviewed by an ex-McKinsey subject-matter expert. Defines the components used in Finding 2.
About the author
Tom Prescott is a former McKinsey Senior Engagement Manager who recruited and interviewed 150+ candidates during his time at the firm, and the founder of SolvePrep. He designed the scoring models behind the three simulators this study draws on, and wrote the McKinsey Solve guide that documents each game's structure.
Conflict of interest: SolvePrep sells access to the simulators the data comes from. The study is therefore published with its query set, its aggregate dataset and its bias controls, so any figure here can be checked rather than taken on trust. Corrections and methodology questions: info@solveprep.com.
How to cite this study
You're welcome to reproduce the findings and the charts above with attribution and a link back to this page. Preferred citation:
SolvePrep, "The State of McKinsey Solve 2026" (v1.2, data cut 20 Aug 2026), solveprep.com/research/state-of-mckinsey-solve-2026
Download the data
Every table on this page is published as an aggregate, non-personal dataset under CC BY 4.0 — reuse it with attribution, including in your own analysis:
Changelog
Release v1.2, data cut August 20, 2026. v1.0 initial release; v1.1 added bootstrap confidence intervals, the regression-to-the-mean controls, the SFL stakeholder component, the component-to-score reconciliation and the open dataset; v1.2 stated the Finding 4 denominators explicitly (including the 221 excluded candidates), relabelled the timing table's runs column, marked the net-of-placebo column descriptive, clarified what the permutation placebo measures, and added references, an author section and a published data dictionary. No point estimate changed in v1.2. For press enquiries, the underlying query set, or a methodology walkthrough: info@solveprep.com.
Every number above came from candidates running the simulators. Add your own first run.
Run a free simulation