The Complete McKinsey Redrock Study Guide (2026): Master the Red Rock Assessment
67% of candidates fail the McKinsey Solve. The McKinsey Redrock Study — the Red Rock half of the assessment — is the analytical half, and most candidates underestimate it.
What Is the McKinsey Redrock Study?
Red Rock — officially called the Redrock Study — is one of the two mini-games inside the McKinsey Solve assessment. While Sea Wolf tests ecosystem building, Red Rock tests quantitative reasoning and data synthesis.
It's a 35-minute timed exercise where you analyze wildlife territory data, perform calculations, write a research report, and answer independent case questions. Unlike Sea Wolf, the four phases are sequential — you complete each phase once.
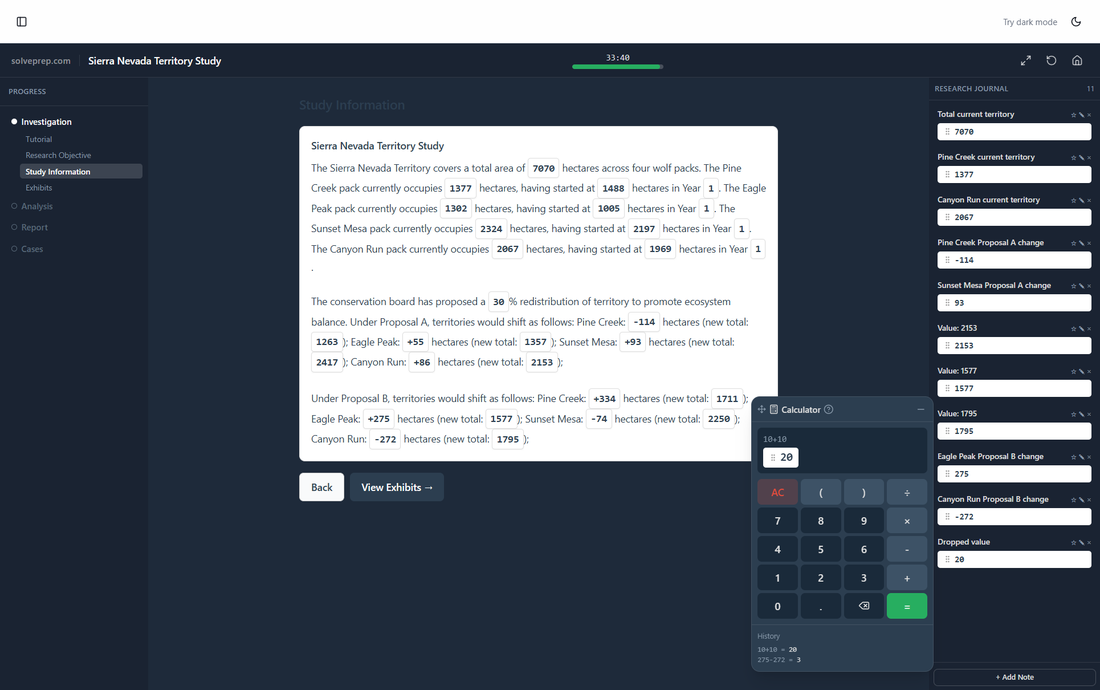
The Investigation phase — gathering data from exhibits
Assessment Structure: The 4 Phases
The Red Rock Study has 4 sequential phases. Unlike Sea Wolf where you repeat steps per site, here each phase is completed once. Budget your time carefully — there's no going back.
Investigation
Review exhibits, gather data, fill your Research Journal
Analysis
3 calculation questions with 2 sub-parts each (60 pts)
Report
Written review + visual chart report (~55 pts)
Cases
6 independent questions with their own exhibits (60 pts)
Phase 1: Investigation
The Investigation phase has 4 sub-steps: Tutorial, Research Objective, Study Information, and Exhibits. This is your data-gathering phase — everything you need for later calculations lives here.
Step 1 Tutorial
A brief walkthrough of the interface. Don't skip it — it explains the calculator drag-to-field mechanic and the Research Journal.
Step 2 Research Objective
Defines what you're analyzing (e.g., territory redistribution across wolf packs). Read carefully — this frames every question that follows.
Step 3 Study Information
A text passage with clickable highlighted numbers. Click them to auto-save to your Research Journal. This saves 3–5 minutes of manual note-taking later.
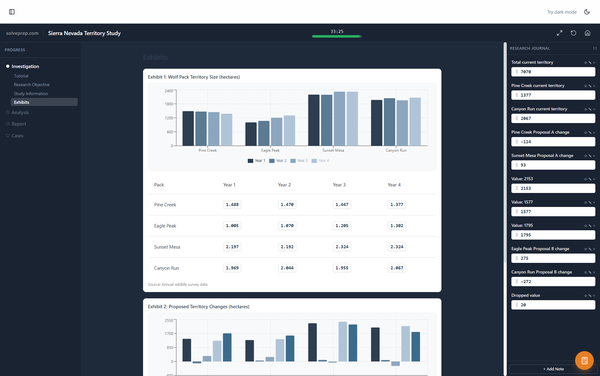
Step 4 Exhibits
Data tables showing territory, yearly trends, and proposal impacts. Cross-reference these with the study text — the answers to Analysis and Cases come directly from here.
💡 Pro tip: Use the Research Journal aggressively. Every clickable number you save is a number you won't have to hunt for during Analysis. Candidates who journal thoroughly save 3–5 minutes on the back half.
Phase 2: Analysis (60 Points)
Three calculation questions, each with 2 sub-parts (6 answers total). Each answer is worth 10 points. Answers are accepted within a tolerance of ±0.5.
Q1: Territory Totals
Sum territory values across packs. Straightforward addition — but watch for which year the question asks about.
Q2: Growth Analysis
Calculate percentage change or absolute growth over the study period. Pay attention to signs — a negative change is a common trap.
Q3: Proposal Comparison
Compare two redistribution proposals. Often requires computing net impact across all packs for each proposal.
💡 Pro tip: The in-game calculator lets you drag results directly into answer fields. Use it for every calculation — even simple ones. Mental math errors under time pressure are the #1 cause of lost points here.
Phase 3: Report (~55 Points)
The Report phase has two parts: a Written Review (~25 pts) and a Visual Report (~30 pts).
Written Review
You're given a pre-written summary paragraph with blanks to fill. Some blanks are dropdowns (select the right option), others are text inputs (type a number or word). The answers come directly from your Analysis results and the original exhibits.
Visual Report
Select the correct chart type (bar, pie, or line) and enter data values for each label. The chart type matters — choosing the wrong one costs you the entire visual score. Think about what the data represents: comparisons → bar, proportions → pie, trends → line.
The Report phase — Written Review + Visual Report
Phase 4: Cases (60 Points)
Six independent questions, each with its own exhibit. Unlike Analysis, these don't build on each other — each is a standalone mini-problem worth 10 points.
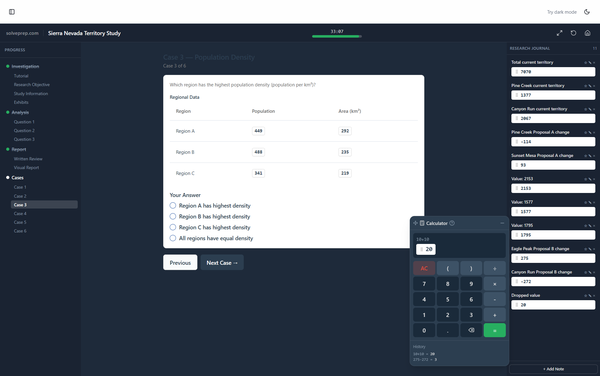
The Cases phase — 6 independent questions
Time warning: Cases appear last when you're most time-pressured. Read the question before studying the exhibit — it tells you exactly what to look for.
Scoring Breakdown
The total maximum score is approximately 175 points. Answers are accepted within a tolerance of ±0.5. Here's the breakdown:
Key insight: Analysis and Cases together make up 120 of 175 points (69%). These are pure calculation — accuracy and speed win here. The Report is important but more forgiving.
Top 6 Strategies to Maximize Your Score
Use the Research Journal aggressively
Click every highlighted number during Investigation. The 30 seconds you spend journaling saves 3–5 minutes of hunting during Analysis and Cases.
Use the calculator for everything
Even simple additions. Under time pressure, mental math errors cost 10 points each. The drag-to-field calculator eliminates transcription errors too.
Budget your time: 15-10-10
Spend ~15 minutes on Investigation + Analysis, ~10 on Report, ~10 on Cases. Most candidates spend too long on Investigation and rush Cases.
Don't second-guess the Written Review
The answers come directly from your Analysis results. If your calculations were right, the fill-in-the-blank answers follow logically. Trust your numbers.
Read the question before the exhibit in Cases
Each case has its own data table. Reading the question first tells you exactly what to look for — scanning a table without context wastes time.
Check signs on percentage calculations
A negative growth rate vs. a positive one is the most common sign error. Double-check whether the question asks for change (can be negative) or absolute value.
Free Trial vs. Full Simulator
If you're serious about becoming a McKinsey consultant, you need to practice with variety — not memorize one answer key. The real Solve generates a unique dataset every time.
Free Trial
- 1 fixed scenario
- No detailed score breakdown
- No Research Journal or Calculator
- No progress tracking
Full Access
- 6 unique scenarios
- Full scoring & breakdown
- Research Journal + Calculator
- Leaderboard + progress tracking
Common Mistakes That Cost You 30+ Points
Not using the Research Journal
Without journaled numbers, you'll waste 3–5 minutes flipping back to exhibits during Analysis and Cases.
Rounding intermediate calculations
The ±0.5 tolerance is tight. Round only your final answer — keep full precision through intermediate steps.
Spending too long on Study Information
Reading the passage is important, but re-reading it 3 times isn't. Journal the key numbers and move on.
Choosing the wrong chart type
The Visual Report scores chart type separately. Bar for comparisons, pie for proportions, line for trends. Think before selecting.
Sign errors on percentage changes
A territory that went from 200 to 180 has a −10% change, not +10%. Double-check the direction.
Skipping the tutorial
The tutorial explains the calculator drag mechanic and journal. Skipping it means fumbling with the interface under time pressure.
What the Real Assessment Looks Like vs. Our Simulator
Our simulator replicates the exact 4-phase structure, the same scoring logic, and the same 35-minute time pressure as the real McKinsey Solve. The key difference: McKinsey generates a unique dataset every time — so should your practice.
Practicing one fixed scenario teaches you that scenario's answers — not the analytical skills you need. Our full simulator offers 6 unique scenarios with different territory data, pack structures, and case questions so you build genuine calculation speed and data fluency.
You Get ONE Shot at the Real Solve
Candidates who practiced 6+ scenarios passed at 3× the rate of those who practiced only one. The Red Rock Study rewards calculation speed — and speed comes from repetition with variety.
1,000+ candidates upgraded and passed
No credit card required. Your first simulation is free.
Looking for other games? Browse all McKinsey Solve simulators